
 06.01.26 Are we amusing ourselves to death? Even more?
Expense tracker: from Excel to PowerBI
Blog > Expense tracker: from Excel to PowerBI
I’ve tried many different apps that offered many reports, features and wathever, but in the last year I tried a new method using an app (Money Lover, but any other will do) to track expenses on the fly and then copy those expenses and transactions into an Excel spreadhseet. I had a sum-up sheet with balances in-out, expense categories, savings, grouped by month and 12 monthly sheets with in and out in which there were also a single month overview. This method (besides the unrealistc budget I set) was too rigid. An extra category I might wanted to add later would have needed to add a single row in every single sheet plus adjusting the tables.
A headache. So I stick with the current configuration for the last year and thinking to do changes on the upcoming one.
Recently I started using PowerBI for my thesis on Business Intelligence and got caught up by its friendliness and depth of its reports (to me, a BI newbie). And thought to give it a try. SPOILER: it’s awesome. But let’s proceed step by step.
Existing Excel Spreadheet(s)
Let’s begin with what I had. A system based on multiple excel spreadsheets containing various data. There were a total of 4 spreadsheets, 3 for accounting and one for overview and charts that gathered data from the previous.
Accounting spreadhseets
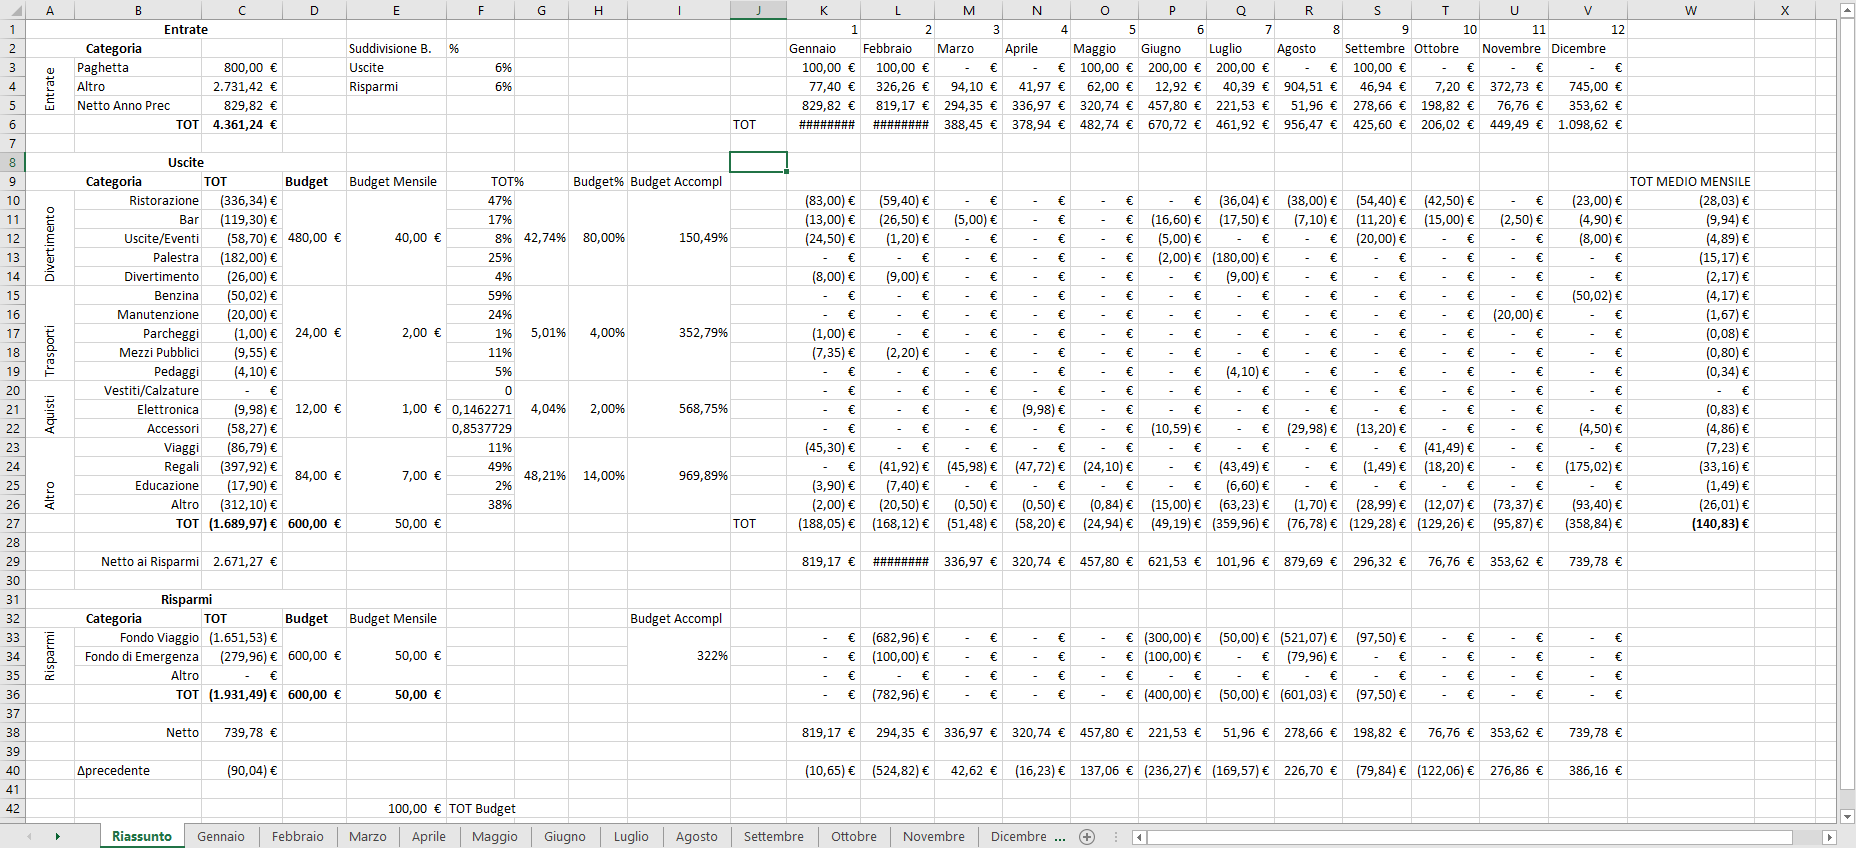
The accounting spreadsheet contained a first sheet of overview that contains lots of summarized data grouped by month and category.
You can see it here:
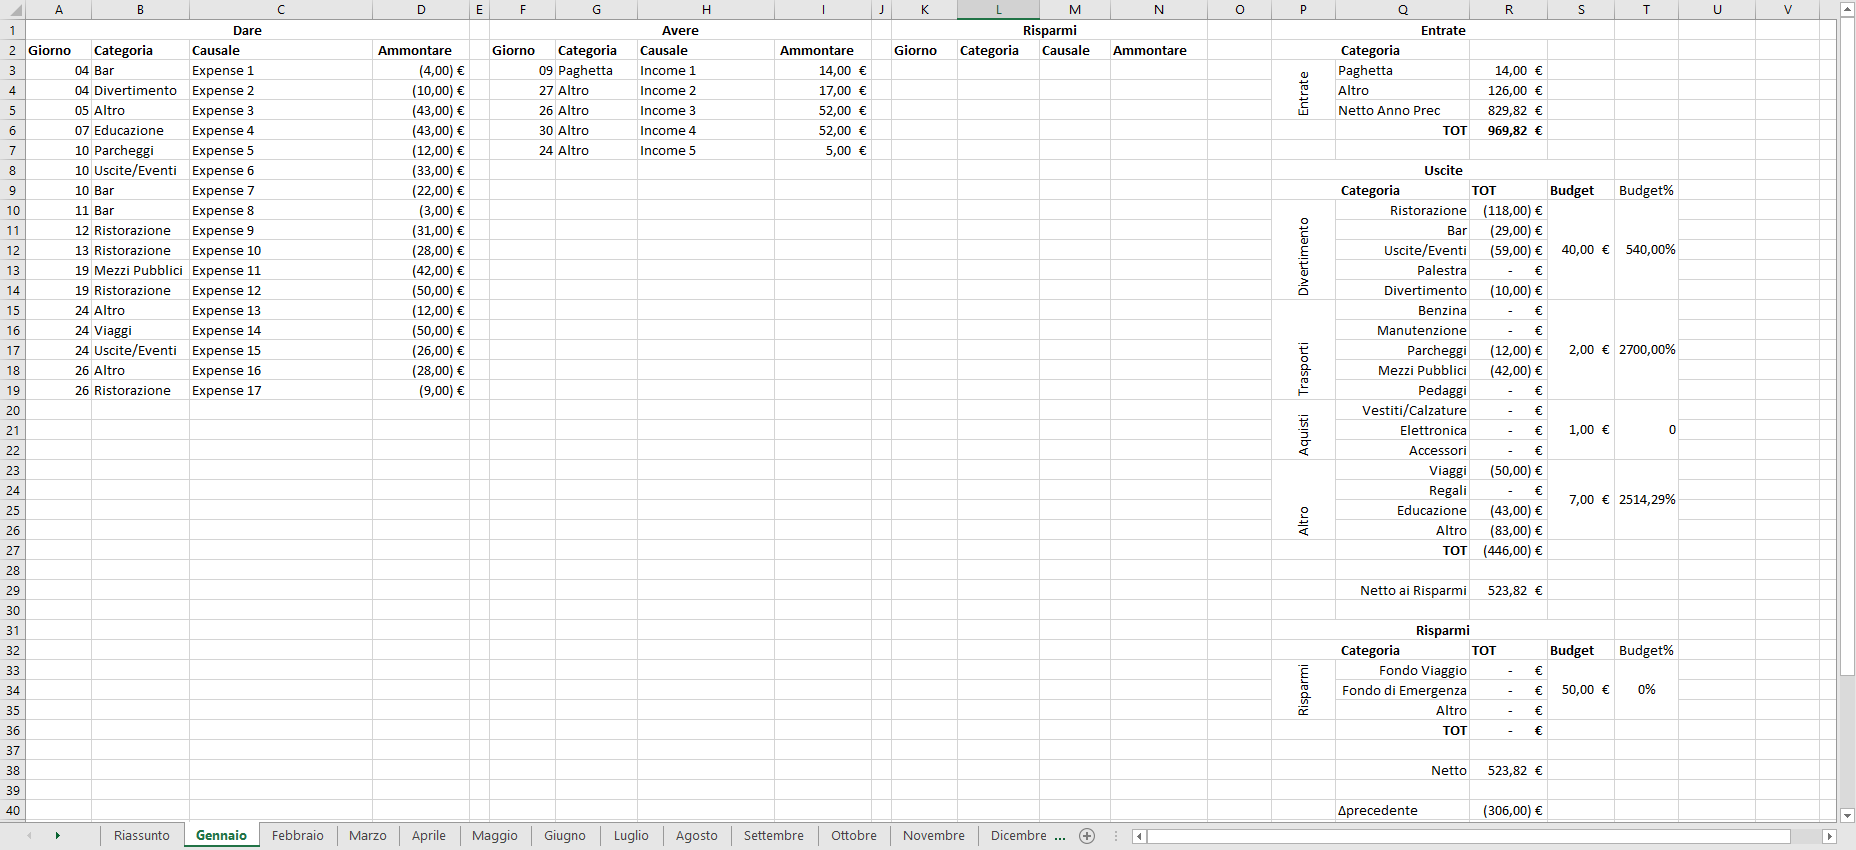
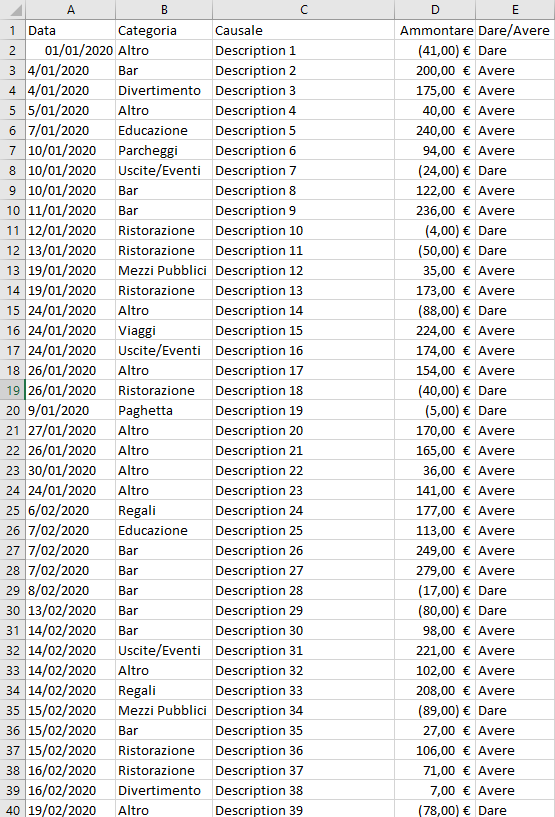
Than each monthly sheet contained two columns: Debit and Credit or Give and Take. (One also contained a separate give column dedicated to saving accounts). Each column contains an expense or income lines with date, category and reason/description.
You can see it here:
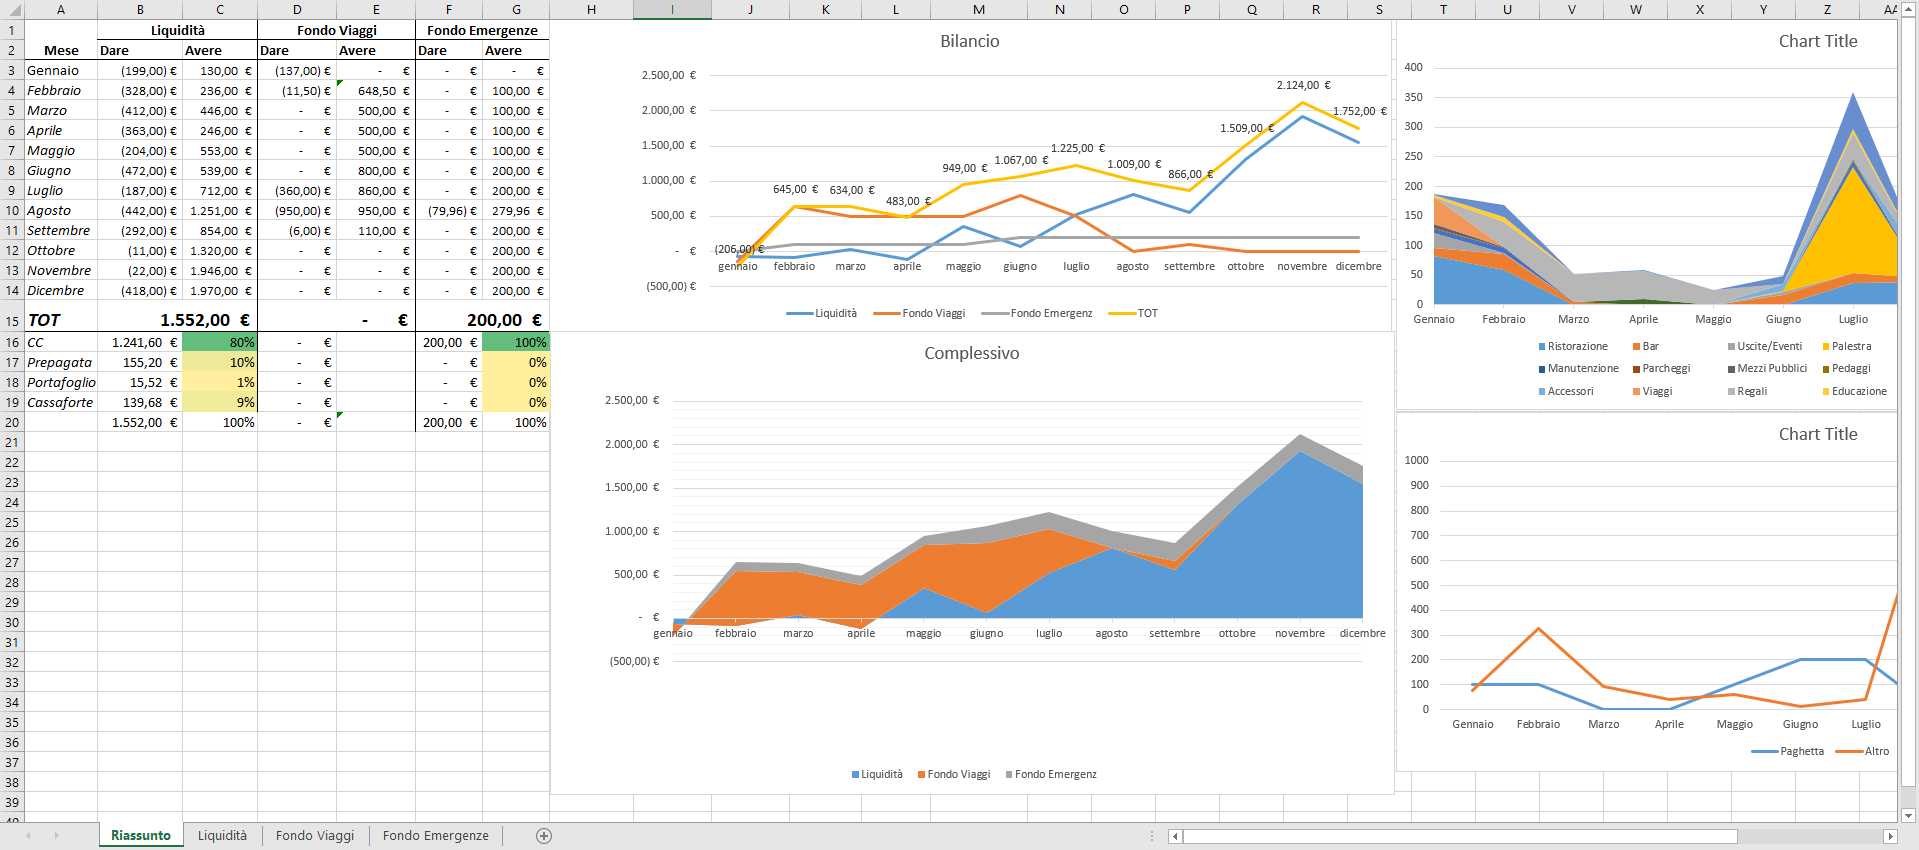
Overview spreadsheet
The overview spreadsheet is nothing more than a collector that then shows highly summarized data and some graphics.
PowerBI
PowerBI is a BI tool that gives many visualizations with many filter options and those visualizations (graphs) are interleaved through the data they’re created from. Thus I decided to see what I could achieve using PowerBI visualizations from the data I already had with a year of transactions.
Loading data from existing spreadsheets
Since PowerBI lets import excel sheets I started by importing the existing spreadsheet.
The problem with this approach is the format of data. It’s not so easily accessible and not formatted for accessibilty rather human readibilty. Thus it required a big ammount of transformations:
- removing columns
- linking
- merging
- …
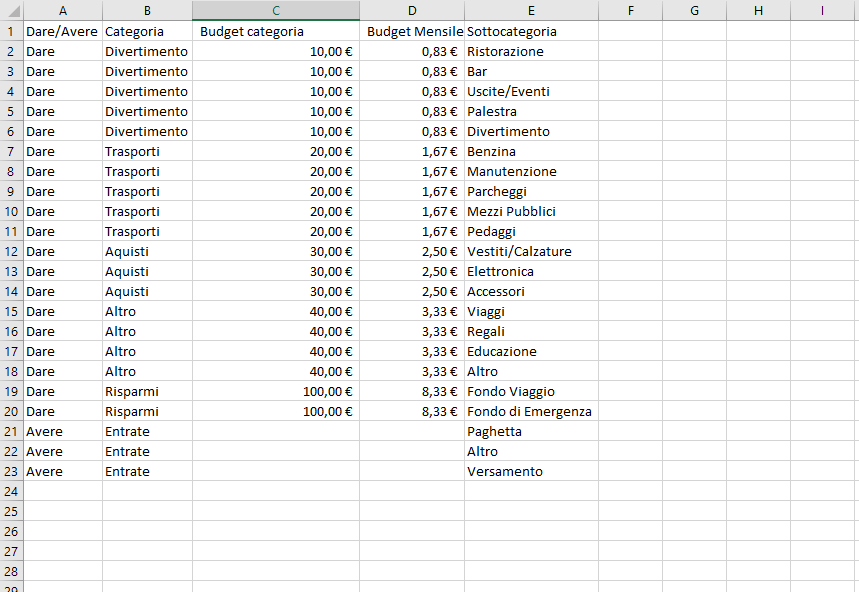
I then started approaching what will be next: I created a date table, with all possible dates and a category table with categories.
New Excel spreadsheet
I then created a new, single, spreadsheet that contained all the data. A category spreadsheet with a date sheet, a category sheet and a sheet for each account (3 in my case) in which there is a line for each transaction either debit or credit, which is indicated in a particular column, that does nothing more than indicate wether the ammount is positive or negative (lol)
This new excel spreadsheet is much easier to work with in PowerBI. It needs to be imported and then it can be worked with simple steps directly from the UI.
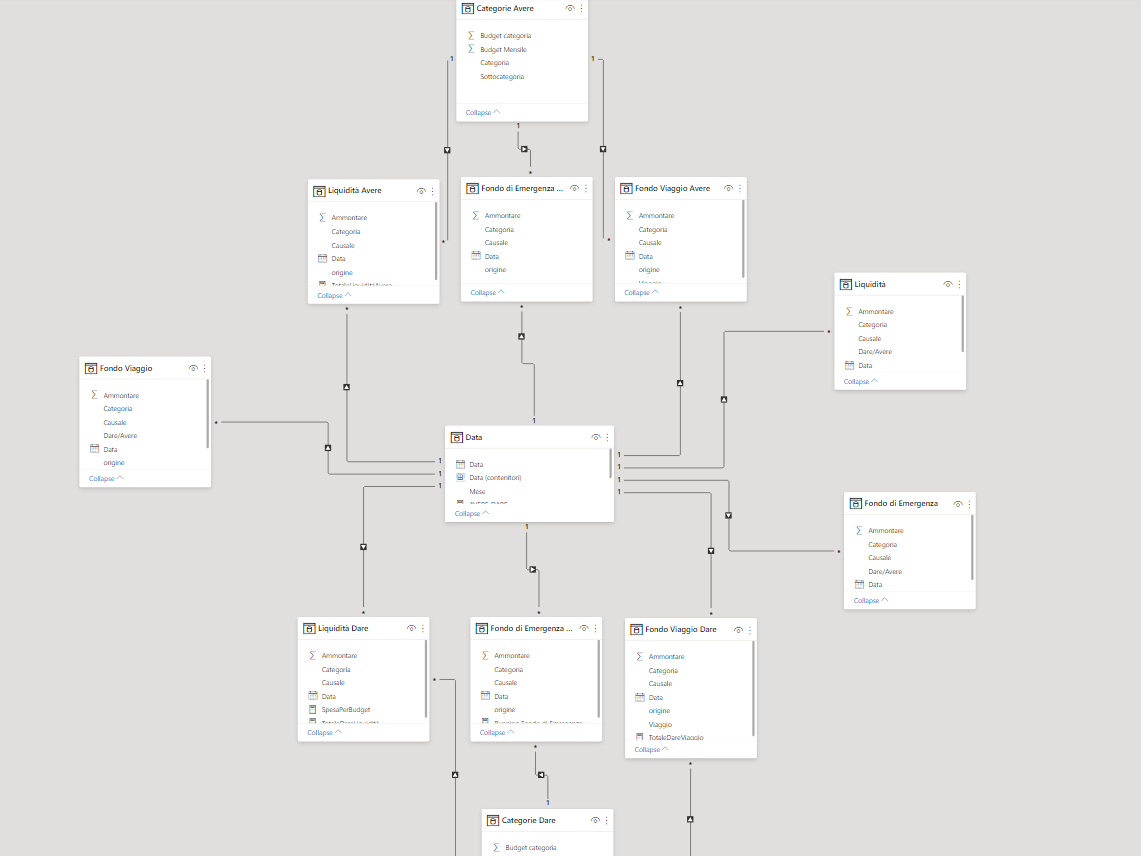
I’ve splitted each account in debit and credit queries by filtering on the column I told above. Splitted the categories in debit and credit categories and connected all queries in the semantic layer by hand since the automatic relations PowerBI found were not the best.
Visualizations: PowerBI full power
With this setup we can unleash all PowerBI visualization power with its many visualizations. I was thus able to create many insights in my expenditure and take actions and considerations faster with clearer data.
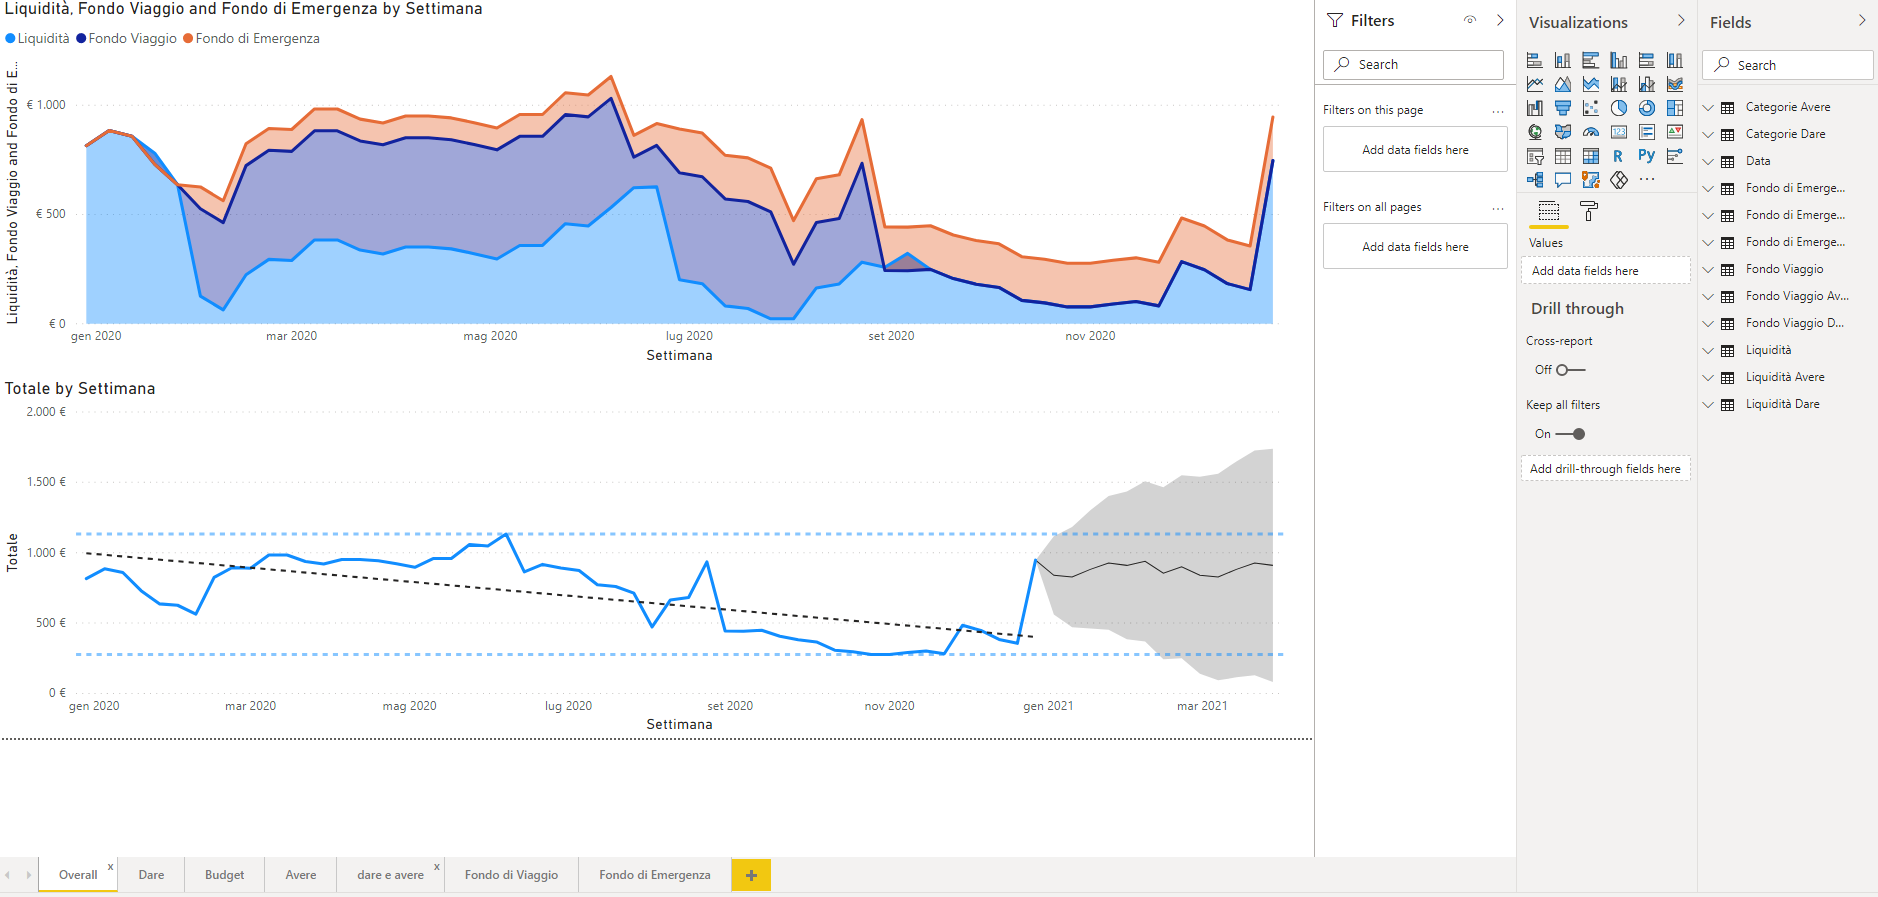
What I call a success.
Also this setup is very flexible, letting the creation of a category as simple as adding the category in its table and then assign it to some expense/income lines as PowerBI does all the connections. Yay!

